Current State of the Market
September 15, 2024:
Last week, the market started showing bullish signs again. We are already in a long-term bull trend, but the last few months have been very choppy for traders, with high volatility and a recent short-term bearish trend. You may have noticed this clearly in your portfolio if you are a stock picker.
Starting Wednesday of last week, several stocks on my watch list started to form bullish setups, and the indices have also turned bullish. The volatility indicator (vix) also came down rapidly and is now testing support.
The FED meeting on September 18 can make or break this trend. However, I am leaning more towards a bullish trend in the next few weeks, especially in the tech, semiconductors, and small caps, as several stocks in these sectors are also showing good chart patterns.
See the analysis breakdown with charts below and one stock pick for the next few weeks as a bonus!
Daily chart of SPY: SPY is retesting the previous high. After a recent sharp downturn (1), a bullish inverted hammer emerged on Wednesday (arrow) with higher volume (2), which moved the index above the closely watched 21-day moving average. 564.7$ is the next big resistance, which should break above (3), which, if it can, can be the beginning of the next big bullish move for the rest of the year. Of course, watch for increased volatility and loss of 21-day support as signs to become very defensive. We may also be at a significant multiple top area.
IWM daily chart: IWM (an indicator of small caps) respected the major support area, had a huge reversal candle on Wednesday, and, by Friday, gapped above the 21-day moving average, showing immense underlying bullish strength.
IWM weekly chart: Closed above 10 and 21-week moving average after a shakeout with higher volume (arrow) and emerged through the long-term resistance (1) since the end of 2021!
Weekly chart of QQQ: reversed from prior week bearish candle and closed bullish
Daily chart of QQQ: See the expectation breaker on Wednesday and how it closed above 21 and 50 day moving averages by the end of week.
Volatility indicator daily chart: Started Monday with a bearish engulfing candle, beginning a short-term downtrend, strengthening on Wednesday (arrow) , and closing slightly below the 21-day moving average (3). However, long-term support is not far away (2) , and looking back from the beginning of September, it is still in bullish consolidation (1) , which is concerning that volatility will continue to be an issue for the rest of the year. Time will tell, but something to keep an eye on to decide on position sizing.
Now, the stock pick!
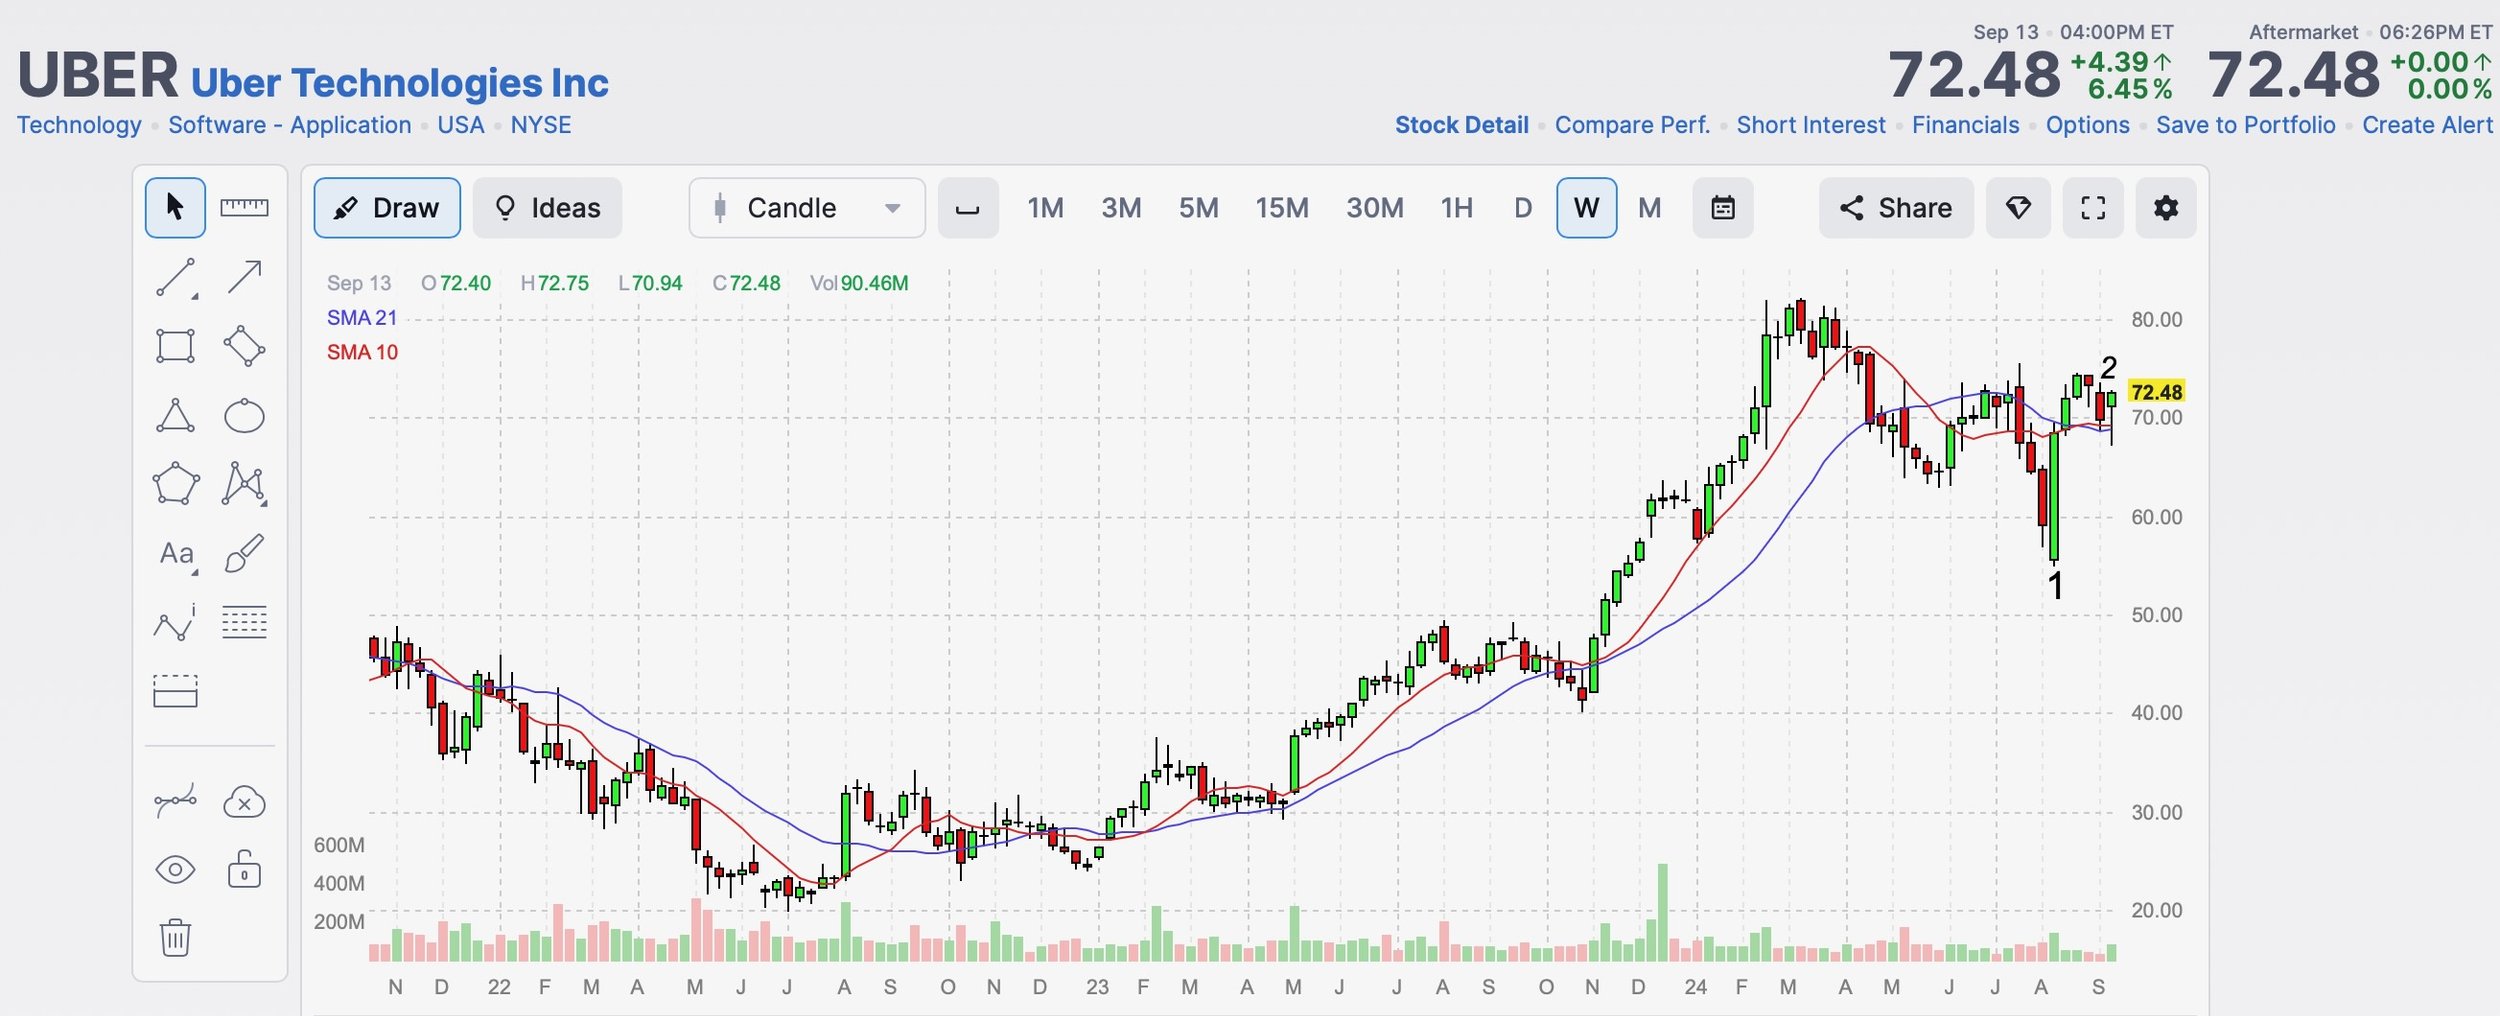
UBER is becoming exciting and looks great for initiating a new position. A month ago, Uber formed a bullish candle, an expectation breaker of the prior short-term downtrend, and the stock closed very bullish on Friday.
Weekly Uber chart: Bullish engulfing candle 5 weeks ago (1). After a brief shakeout, strong weekly close (2).


